Understanding the 52-Week Low vs. 52-Week High in Investing: A Key Indicator for Smart Decision-Making
When analyzing a stock or other financial asset, one of the most referenced indicators is the 52-week range, which includes the 52-week low and the 52-week high. These figures are essential components in technical analysis, investment strategy, and market sentiment evaluation. Let’s break down what these terms mean, how they’re used, and why they matter in today’s fast-moving investment environment.

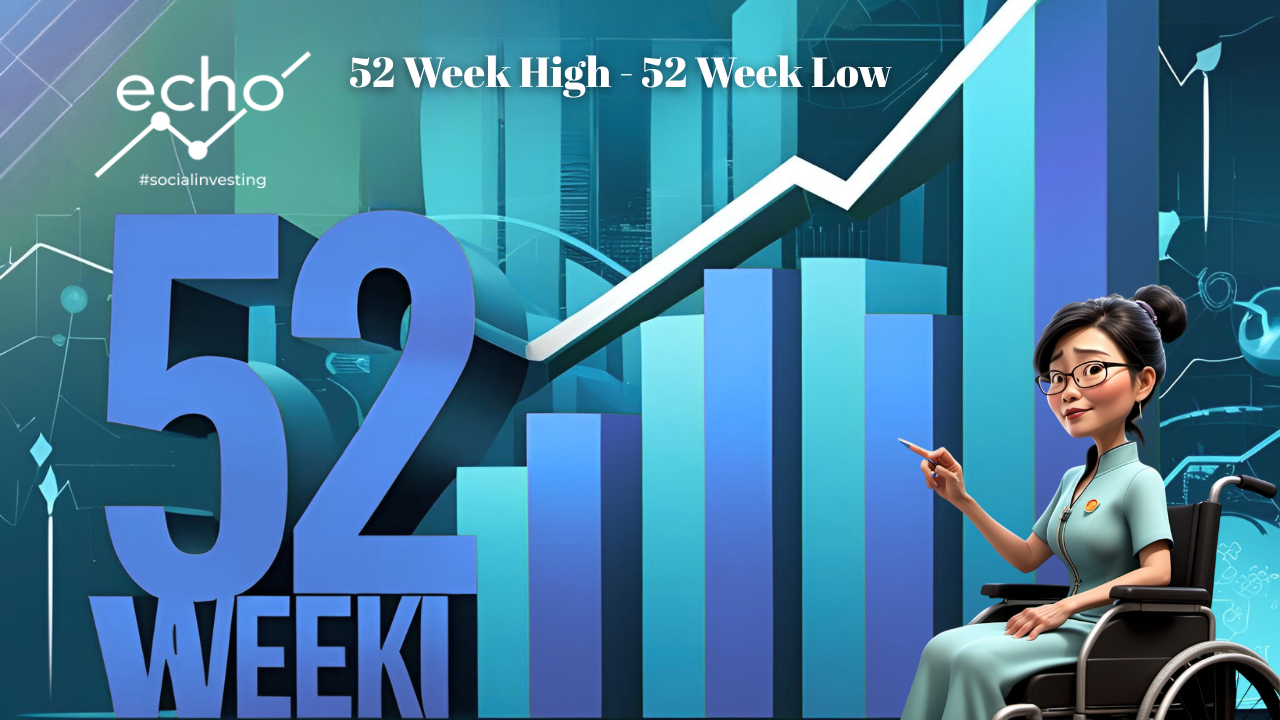
???? What Is the 52-Week High?
The 52-week high is the highest price at which a security has traded during the past 52 weeks (one year). It serves as a benchmark of peak performance, indicating strong bullish momentum, increased buying interest, or even speculative excitement.
Investors often use the 52-week high to identify resistance levels, where prices may struggle to move higher without significant positive news or strong earnings reports. In some cases, breaking past the 52-week high can trigger breakout trading, where traders anticipate accelerated upside potential due to increased demand and investor enthusiasm.
???? What Is the 52-Week Low?
The 52-week low, conversely, is the lowest price at which a security has traded in the past year. It’s often viewed as a support level or a possible entry point for value investors who believe the stock is undervalued or temporarily out of favor.
When a stock is trading near its 52-week low, it can indicate negative market sentiment, poor financial performance, or external challenges like regulatory changes or economic downturns. However, savvy investors sometimes see this as a buying opportunity, especially if the company has strong fundamentals, a solid balance sheet, and potential for recovery.
???? Why It Matters to Investors
Understanding the 52-week high and low gives investors key context when evaluating price action, market volatility, and risk-reward ratios. Here’s how it can shape your investment strategy:
Risk Management: Knowing where a stock sits in its 52-week range helps you measure downside risk versus upside potential.
Sentiment Gauge: A stock near its high may signal investor confidence, while one near its low could reflect fear or uncertainty.
Technical Analysis: These levels are used in chart patterns to detect breakouts, trend reversals, or momentum shifts.
Investment Timing: Whether you're pursuing growth investing, value investing, or swing trading, 52-week data informs when to buy or sell.
⚠️ Cautions and Considerations
While the 52-week range is useful, it shouldn’t be the sole factor in making investment decisions. It’s important to pair this data with fundamental analysis, P/E ratios, earnings reports, and macroeconomic trends. Stocks can remain near their lows for a reason—or break past highs due to temporary hype. Always align technical indicators with your broader financial goals and investment horizon.
✅ Final Thoughts
The 52-week low and high are more than just numbers—they’re powerful tools in an investor’s toolkit. By understanding how to interpret them, you can better navigate the markets, avoid emotional investing, and spot opportunities others may miss. Whether you're trading individual stocks, ETFs, or even REITs, staying aware of a security’s 52-week range helps you make informed, data-driven decisions.
Want more insights like this? ???? Visit Echo Investing to explore in-depth blogs, guides, and tools for every level of investor.
#InvestingBasics #TechnicalAnalysis #FinancialEducation #StockMarketTips #52WeekHigh #52WeekLow #MarketTrends #RiskManagement #EchoInvesting #InvestLoud #SocialInvesting
Invite Friends & Colleagues
Post On